UK economic growth forecast upgraded

Economic review September 2024

On markets at the end of September, with investors and traders closely monitoring regional developments. 

At month end, stocks retreated following implications from Federal Reserve Chairman Jerome Powell that further interest rate cuts are likely to occur at a more measured pace.

Across the pond, the Dow Jones closed the month up 1.85% on 42,330.15. The tech-orientated NASDAQ closed the month up 2.68% on 18,189.17.

On home shores, the FTSE 100 index closed the month on 8,236.95, a loss of 1.67%, while the FTSE 250 closed the month 0.16% lower on 21,053.19. The FTSE AIM closed on 740.43, a loss of 4.15% in the month. The Euro Stoxx 50 closed the month on 5,000.45, up 0.86%. In Japan, the Nikkei 225 closed September on 37,919.55, a monthly loss of 1.88%.

On the foreign exchanges, the euro closed the month at €1.20 against sterling. The US dollar closed at $1.33 against sterling and at $1.11 against the euro.

Brent crude closed September trading at $71.65 a barrel, a loss over the month of 6.74%. The conflict in the Middle East is causing some price volatility. OPEC+ plans to begin increasing production in December is pressurising prices, while weak demand in China also weighs. Gold closed the month trading at $2,629.95 a troy ounce, a monthly gain of 4.64%. Prices retreated at month end, reversing recent strong gains as increased safe-haven demand prompted a rally in the precious metal.

Index

Value (30/09/24)

Movement since 30/08/24

FTSE 100 8,236.95 -1.67%
FTSE 250 21,053.19 -0.16%
FTSE AIM 740.43 -4.15%
Euro Stoxx 50 5,000.45 +0.86%
NASDAQ Composite 18,189.17 +2.68%
Dow Jones 42,330.15 +1.85%
Nikkei 225 37,919.55 -1.88%

Retail sales stronger than expected

The latest official retail sales statistics revealed a healthy growth in sales volumes during August, while more recent survey data points to further modest improvement both last month and in October.

Figures released by ONS showed that total retail sales volumes rose by 1.0% in August, following upwardly revised monthly growth of 0.7% in July. ONS reported that August’s rise, which was higher than economists had predicted, was boosted by warmer weather and end-of-season sales.

Evidence from last month’s CBI Distributive Trades Survey also suggests retailers expect the summer sales improvement to have continued into the autumn period, with its annual retail sales gauge rising to +4 in September from -27 in August. In addition, retailers’ expectations for sales in the month ahead (October) rose to +5; this represents the strongest response to this question since April 2023.

CBI Principal Economist Martin Sartorius said retailers would “welcome” the modest sales growth reported in the latest survey. He also added a note of caution saying, “While some firms within the retail sector are beginning to see tailwinds from rising household incomes, others report that consumer spending habits are still being affected by the increase in prices over the last few years.”

National debt looks set to soar

Analysis published last month by the Office for Budget Responsibility (OBR) suggests national debt could triple over the coming decades if future governments take no action.

In its latest Fiscal Risks and Sustainability Report, the OBR said debt is currently on course to rise from almost 100% of annual GDP to 274% of GDP over the next 50 years due to pressures including an ageing population, climate change and geopolitical risks. It also warned that, without any change in policy or a return to post-war productivity levels, the public finances were unsustainable over the long term, and that ‘something’s got to give.’

The OBR is also tasked with producing a more detailed five-year outlook for the country’s finances that will be published alongside Chancellor Rachel Reeves’ first Budget, due to be delivered on 30 October. The Chancellor has previously warned the Budget will involve “difficult decisions” on tax, spending and welfare.

Data released last month by ONS showed that government borrowing in August totalled £13.7bn, the highest figure for that month since 2021. This took borrowing in the first five months of the financial year to £64.1bn, £6bn higher than the OBR forecast at the last Budget.

All details are correct at the time of writing (1 October 2024)

It is important to take professional advice before making any decision relating to your personal finances. Information within this document is based on our current understanding and can be subject to change without notice and the accuracy and completeness of the information cannot be guaranteed. It does not provide individual tailored investment advice and is for guidance only. Some rules may vary in different parts of the UK. We cannot assume legal liability for any errors or omissions it might contain. Levels and bases of, and reliefs from taxation are those currently applying or proposed and are subject to change; their value depends on the individual circumstances of the investor. No part of this document may be reproduced in any manner without prior permission.

This material is intended for information purposes only and is not intended as an offer or solicitation for the purchase or sale of any financial instrument. Tees is a trading name of Tees Financial Limited, which is regulated and authorised by the Financial Conduct Authority. Registered number 211314.

Tees Financial Limited is registered in England and Wales. Registered number 4342506.
Unexpected economic boost: UK growth outpaces forecasts

Economic Review July 2024

Figures released last month by the Office for National Statistics (ONS) showed the UK economy grew faster in May than had been predicted, while survey evidence points to a more recent post-election pick-up in business activity.

The latest gross domestic product (GDP) statistics revealed that economic output rose by 0.4% in May, twice the level forecast in a Reuters poll of economists. May’s figure also represented a strong rebound from the zero-growth rate recorded in April, with a broad-based increase in output as the services, manufacturing, and construction sectors all posted positive rates of growth.

ONS also noted that growth was relatively strong in the three months to May, with GDP rising by 0.9% in comparison to the previous three-month period. This represents the UK economy’s fastest growth rate for more than two years.

Evidence from a closely watched economic survey also suggests private sector output picked up last month following a lull in the run-up to July’s General Election. The preliminary headline growth indicator from the latest S&P Global/CIPS UK Purchasing Managers’ Index (PMI) stood at 52.7 in July, slightly ahead of analysts’ expectations and up from a six-month low of 52.3 in June. Manufacturing output was particularly strong, with this sector expanding at its fastest rate in almost two and a half years.

Commenting on the findings, S&P Global Market Intelligence’s Chief Business Economist Chris Williamson said, “The flash PMI survey data for July signal an encouraging start to the second half of the year, with output, order books and employment all growing at faster rates amid rebounding business confidence. The first post-election business survey paints a welcoming picture for the new government, with companies operating across manufacturing and services having gained optimism about the future and reporting a renewed surge in demand.”

Fresh signs of cooling jobs market

Last month’s release of labour market statistics revealed further signs of a softening in the UK jobs market with pay growth easing and another drop in the overall number of vacancies.

Recently released ONS figures showed that average weekly earnings, excluding bonuses, rose at an annual rate of 5.7% in the three months to May. Although this was in line with analysts’ expectations, it did represent a modest decline from the 6.0% recorded during the previous three-month period and was the slowest reported rate of pay growth since the summer of 2022.

ONS said the latest release suggested pay growth is now showing ‘signs of slowing again’ although it also pointed out that, in real terms, wage growth still stands at a two-and-a-half-year high. Indeed, after adjusting for inflation using the Consumer Prices Index including owner occupiers’ housing costs, regular pay rose by 2.5% in the three months to May.

The data also revealed a further fall in the number of job vacancies, with 30,000 fewer reported in the April–June period compared to the previous three months. While at 889,000, the total is still significantly higher than pre-pandemic levels, this latest fall was the 24th successive monthly decline in the overall level of vacancies.

ONS highlighted other signs of ‘cooling’ in the labour market as well, with growth in the number of employees on the payroll said to be ‘weakening over the medium term.’ Additionally, while the latest release did show the unemployment rate unchanged at 4.4%, ONS noted that the rate has been ‘gradually increasing.’

The statistics agency also provided an update on its plans to improve reliability of the labour market data. A switch to a new version of its Labour Force Survey, which had been due to take place in September, has now been delayed until next year.

Markets (Data compiled by TOMD)

On the last day of July, US equities were supported as investors contemplated the latest move from the Federal Reserve to retain rates, with indicators from Fed Chair Jerome Powell that a September cut “could be on the table.”

The tech-oriented NASDAQ responded positively after a challenging few days as initial earnings from some tech mega caps disappointed. The NASDAQ closed July down 0.75% on 17,599.40, while the Dow Jones closed the month up 4.41% on 40,842.79.

The UK’s blue-chip FTSE 100 had a boost on 31 July, with a series of strong headline earnings supporting, while traders await the Bank of England’s next interest rate decision. The index closed the month on 8,367.98, a gain of 2.50% during July, while the FTSE 250 closed the month 6.48% higher on 21,600.71. The FTSE AIM closed on 787.02, a gain of 2.96% in the month. The Euro Stoxx 50 closed July on 4,872.94, down 0.43%. The Japanese Nikkei 225 closed the month on 39,101.82, a monthly loss of 1.22%.

On the foreign exchanges, the euro closed the month at €1.18 against sterling. The US dollar closed at $1.28 against sterling and at $1.08 against the euro.

Brent crude closed July trading at $80.91 a barrel, a loss over the month of 4.56%. With Middle East conflicts escalating, crude prices were impacted as markets closely watch geopolitical developments. Gold closed the month trading at $2,426.30 a troy ounce, a monthly gain of 4.09%.

Index

Value (31/07/24)

Movement since 28/06/24

FTSE 100 8,367.98 +2.50%
FTSE 250 21,600.71 +6.48%
FTSE AIM 787.02 +2.96%
Euro Stoxx 50 4,872.94 -0.43%
NASDAQ Composite 17,599.40 -0.75%
Dow Jones 40,842.79 +4.41%
Nikkei 225 39,101.82 -1.22%

Headline inflation rate holds steady

Consumer price statistics published last month by ONS showed that the UK headline rate of inflation was unchanged in June defying analysts’ expectations of a slight fall.

According to the latest inflation figures, the Consumer Prices Index (CPI) 12-month rate – which compares prices in the current month with the same period a year earlier – remained at 2.0% in June. This was marginally above the 1.9% consensus forecast taken from a Reuters poll of economists.

The largest downward pressure on June’s CPI rate came from the clothing and footwear sector, which ONS said was due to a higher level of discounting in this year’s summer sales compared to 2023. Hotel prices, however, rose by a significantly greater extent this June than last year, while a comparatively smaller fall in the costs of second-hand cars also put upward pressure on the headline rate.

Just prior to release of June’s data, the International Monetary Fund (IMF) warned that the UK was among a number of countries witnessing some ‘persistence’ in inflation, particularly in relation to services inflation. The IMF added that this was ‘complicating monetary policy normalisation’ with the ‘upside risks to inflation’ raising the prospects of interest rates staying ‘higher for even longer.’

Cooler weather hits retail sector

The latest official retail sales statistics revealed declining sales volumes after unseasonably cool weather deterred shoppers. At the same time, more recent survey data suggests the retail environment remains challenging.

ONS figures released last month showed that total retail sales volumes fell by 1.2% in June, following strong growth during May. ONS said June saw a decline across most sectors, particularly those sensitive to weather changes such as department stores and clothes shops. Retailers blamed poor weather and low footfall, as well as election uncertainty, for dampening sales.

Evidence from the latest CBI Distributive Trades Survey shows trading conditions have remained difficult, with its headline measure of sales volumes in the year to July dropping to -43% from -24% the previous month. The CBI described July as a ‘disappointing’ month for retailers, blaming a combination of ‘unfavourable weather conditions’ and ‘ongoing market uncertainty.’

The survey also found that the retail sector expects the weak outlook to continue this month, although August’s fall in sales volumes is forecast to be slower (-32%). The CBI also noted some glimmers of optimism, with several retailers expressing hopes for ‘an improvement in market conditions post-general election.’

All details are correct at the time of writing (1 August 2024)

It is important to take professional advice before making any decision relating to your personal finances. Information within this document is based on our current understanding and can be subject to change without notice, and the accuracy and completeness of the information cannot be guaranteed. It does not provide individually tailored investment advice and is for guidance only. Some rules may vary in different parts of the UK. We cannot assume legal liability for any errors or omissions it might contain. Levels and bases of relief from taxation are currently applied or proposed and are subject to change; their value depends on the investor’s individual circumstances. No part of this document may be reproduced without prior permission.

This material is intended for information purposes only and is not intended as an offer or solicitation for the purchase or sale of any financial instrument. Tees is a trading name of Tees Financial Limited, which is regulated and authorised by the Financial Conduct Authority. Registered number 211314.

Tees Financial Limited is registered in England and Wales. Registered number 4342506.

Bank of England hints at imminent rate cuts amid economic shifts

Economic Review June 2024 – the prospect of a rate cut moves closer

While last month once again saw the Bank of England (BoE) leave interest rates unchanged at a 16-year high, the minutes of the Bank’s Monetary Policy Committee (MPC) meeting signalled a notable change in tone. Economists now view a rate cut as the most likely outcome when the MPC next convenes.

At its latest meeting, which concluded on 19 June, the MPC voted by a 7–2 majority to maintain the Bank Rate at 5.25%. For the second month running, the two dissenting voices called for an immediate quarter-point reduction, while, for the first time, some other members described their thinking as being “finely balanced.”

The meeting minutes also highlighted this potentially significant shift in stance, noting that the MPC will now examine whether ‘the risks from inflation persistence are receding.’ The minutes concluded, ‘On that basis, the Committee will keep under review for how long Bank Rate should be maintained at its current level.’

Last month’s inflation statistics published by the Office for National Statistics (ONS) before the MPC announcement revealed that the headline rate has returned to its 2% target level for the first time in almost three years. In a statement released alongside the MPC decision, BoE Governor Andrew Bailey described that as “good news.” He also said that policymakers need to be sure inflation will remain low and added, “that’s why we’ve decided to hold rates for now.”

July’s release of economic data, particularly in relation to wage growth and services inflation, is likely to prove pivotal to the next MPC decision, which is due to be announced on 1 August. A recent Reuters survey, however, found that most economists now expect an imminent cut, with all but two of the 65 polled predicting an August rate reduction.

Survey data signals a slowing pace of growth

Official data published last month revealed that the UK economy failed to grow in April, while survey evidence points to a more recent slowdown in private sector output due to rising uncertainty in the run-up to the General Election.

The latest monthly economic growth statistics released by ONS showed the UK economy flatlined in April, as most economists had predicted. Some sectors did report growth; services output, for instance, was up by 0.2%, a fourth consecutive monthly rise, with both the information and technology and the professional and scientific industries reporting rapid expansion across the month.

Other sectors, however, contracted, with ONS saying some were hit by April’s particularly wet weather. A number of retail businesses, for example, told the statistics agency that above-average rainfall had dented their trade during the month. Activity across the construction industries was also believed to have been impacted by the wetter weather.

More recent survey data also suggests private sector output is now growing at its slowest rate since the economy was in recession last year. Preliminary data from the S&P Global/CIPS UK Purchasing Managers’ Index (PMI) revealed that its headline economic growth indicator fell to 51.7 in June from 53.0 in May, a larger decline than analysts had been expecting. While the latest figure does remain above the 50 threshold, denoting growth in private sector output, it was the indicator’s lowest reading since November 2023.

Regarding the data, S&P Global Market Intelligence’s Chief Business Economist Chris Williamson said, “Flash PMI survey data for June signalled a slowing in the pace of economic growth. The slowdown, in part, reflects uncertainty around the business environment in the lead-up to the General Election, with many firms seeing a hiatus in decision-making pending clarity on various policies.”

Markets (Data compiled by TOMD)

As June drew close, global indices were mixed as a raft of economic data was released. Stronger-than-expected GDP data in the UK at month end fuelled speculation over the timing of interest rate cuts, while in the US, the latest inflation reading boosted market sentiment, and unemployment data came in below estimates.

Although the FTSE 100 registered its first monthly decline in four months, the upward revision to Q1 GDP on 28 June supported sentiment around UK-focused equities at month’s end. The main UK index closed June at 8,164.12, a loss of 1.34% during the month, while the FTSE 250 closed the month 2.14% lower at 20,286.03. The FTSE AIM closed at 764.38, a loss of 5.14% in the month. The Euro Stoxx 50 closed June on 4,894.02, down 1.80%. In Japan, the Nikkei 225 closed the month at 39,583.08, a monthly gain of 2.85%. Meanwhile, in the US, the Dow closed the month up 1.12% at 39,118.86, and the NASDAQ closed June up 5.96% at 17,732.60.

On the foreign exchanges, the euro closed the month at €1.17 against sterling. The US dollar closed at $1.26 against sterling and at $1.07 against the euro.

Gold closed June trading at around $2,330.90 a troy ounce, a monthly loss of 0.74%. Brent crude closed the month trading at $84.78 a barrel, a gain of 4.18%. The price rose during the month as indicators suggested an expanded military conflict in the Middle East, which could further disrupt the production of OPEC+ member Iran.

Index

Value (28/06/2024)

Movement since 31/05/024

FTSE 100 8,164.12 -1.34%
FTSE 250 20,286.03 -2.14%
FTSE AIM 764.38 -5.14%
Euro Stoxx 50 4,894.02 -1.80%
NASDAQ Composite 17,732.60 +5.96%
Dow Jones 39,118.86 +1.12%
Nikkei 39,583.08 +2.85%

Retail sales rebound strongly in May

The latest official retail sales statistics revealed strong growth in sales volumes during May after heavy rain dampened activity in the previous month, although more recent survey data does suggest the retail environment remains challenging.

ONS data published last month showed that total retail sales volumes rose by 2.9% in May, a strong bounce back from April’s 1.8% decline. ONS said sales volumes increased across most sectors, with clothing retailers and furniture stores enjoying a particularly strong rebound from the previous month’s weather-impacted figures.

Evidence from the latest CBI Distributive Trades Survey, however, suggests May’s recovery has proved to be short-lived. Its headline measure of sales volumes in the year to June fell to -24% from +8% the previous month. While the CBI did note that unseasonably cold weather may have impacted June’s figures, the data certainly suggests that retailers still face a tough trading environment.

CBI Interim Deputy Chief Economist Alpesh Paleja said, “Consumer fundamentals are improving, with inflation now at the Bank of England’s 2% target and real incomes rising. But it’s clear that households are still struggling with the legacies of the cost-of-living crisis, with the level of prices still historically high in some areas.”

Financial challenges await the new government

Data released by ONS last month showed that UK public sector debt is now at its highest level for over 60 years, while the Institute for Fiscal Studies (IFS) has warned that the next government will face a fiscal ‘trilemma.’

The latest public sector finance statistics revealed that government borrowing totalled £15bn in May, the third highest amount ever recorded for that month. Although the figure was £800m higher than May last year, it did come in below analysts’ expectations and was £600m less than the Office for Budget Responsibility had predicted in its latest forecast.

Despite this, the data also showed that public sector net debt as a percentage of economic output has now risen to 99.8%. This was up 3.7 percentage points from last May’s figure, leaving this measure of debt at its highest level since 1961.

Analysis by the IFS has also highlighted the scale of the financial challenge awaiting whichever party wins the forthcoming General Election. The IFS said that, unless economic growth is stronger than expected, the incoming government will face a ‘trilemma,’ either having to raise taxes more than their manifestos imply, implement cuts to some areas of public spending or allow the national debt to continue rising.

All details are correct at the time of writing (1 July 2024)

It is important to take professional advice before making any decision relating to your personal finances. Information within this document is based on our current understanding and can be subject to change without notice, and the accuracy and completeness of the information cannot be guaranteed. It does not provide individually tailored investment advice and is for guidance only. Some rules may vary in different parts of the UK. We cannot assume legal liability for any errors or omissions it might contain. Levels and bases of and reliefs from taxation are currently applied or proposed and are subject to change; their value depends on the investor’s individual circumstances. No part of this document may be reproduced without prior permission.

This material is intended for information purposes only and is not intended as an offer or solicitation for the purchase or sale of any financial instrument. Tees is a trading name of Tees Financial Limited, regulated and authorised by the Financial Conduct Authority and registered number 211314.

Tees Financial Limited is registered in England and Wales and registered number 4342506.

Investing for the long term – lessons from the past

The emergence of COVID-19 brought a rapid end to the drawn-out recovery of major stock markets from the share price lows associated with the financial crisis a decade ago. When the scale of the threat to lives and livelihoods became apparent, market analysts and investors reassessed the global economic outlook and corporate prospects; they didn’t like what they saw and a wave of selling followed, with inevitable consequences. Most share prices, and thus stock indices, were impacted, with market volatility continuing throughout 2020.

Market analysts and investors aren’t infallible, but when something like COVID-19 strikes they get nervous because closed borders, flight bans and lockdowns can pose a threat even to large companies, especially in exposed sectors. Axed dividends and distressed rights issues are anathema to the jittery; and the largest blue-chip companies aren’t immune. Little wonder then that the 100 shares comprising the UK’s blue-chip share index, the FTSE 100, rapidly lost about one-third of their combined value in late Februaryv and March 2020.

Lessons from history

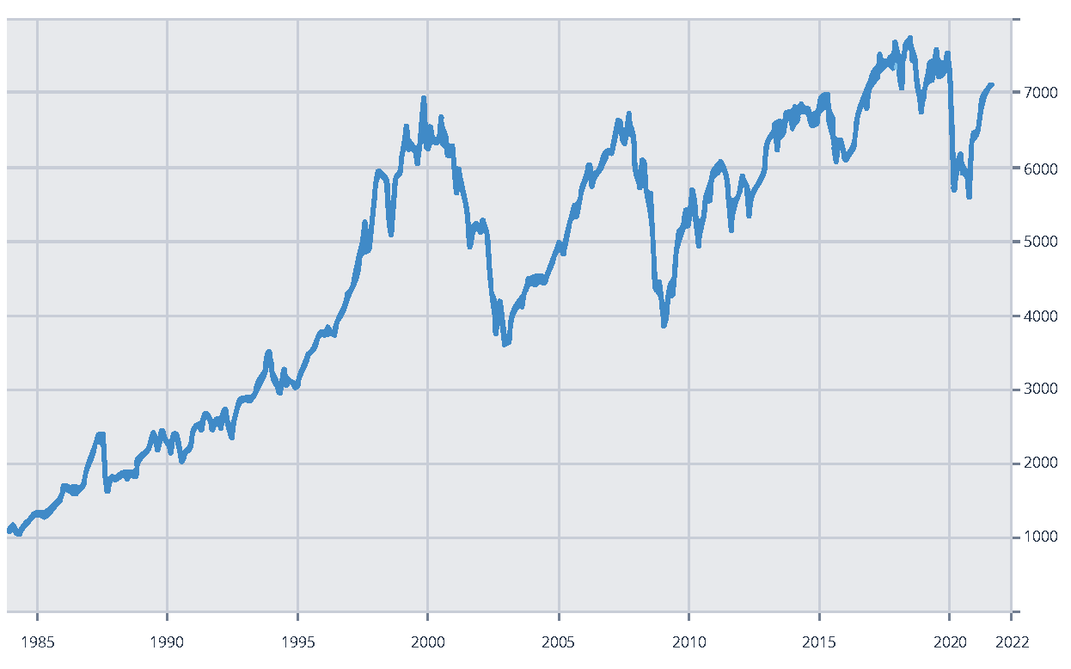
Created in 1984 with a starting level of 1,000 points to provide a wider index of leading shares quoted in London, the FTSE 100 largely superseded the narrower Financial Times 30-share index launched in 1935. As a barometer of economic outlook and corporate prospects, the FTSE 100 has gauged a few storms over the past 36 years. A chart of its progress reveals a plethora of spikes and dips, the starkest of which can be associated with key events in recent financial history.

graph2

Chart: FTSE 100 since inception to 1 September 2021, source Yahoo and Trading Economics

Not the first FTSE 100 dip

After its launch on 3 January 1984, the FT’s new share index only slipped very briefly below 1,000 points that year. It then made progress, sometimes faltering, to hit 2,000 points by March 1987, by then buoyed by the effect of the previous October’s ‘Big Bang’ modernisation of the London Stock Exchange’s trading structure. Six months of further upticks followed and the index broke through 2,350 in early October 1987. It would be two years before that level was attained again.

On 19 October 1987, the Monday after The Great Storm ravaged Southern England, global stock markets suffered a crash so severe that the day became known as Black Monday. A tsunami of selling, much of it blamed on new-fangled computer-program trading, rapidly took the FTSE 100 down to around 1,600, starting with an 11% drop on the Monday and 12% the next day.

A 1,000-point drop

High interest rates and other threats to UK economic growth and even talk of an impending recession brought a 1,000-point drop in the FTSE 100 in the autumn of 1998, almost all of it recovered by the year-end. General bullishness continued through 1999, which ended with the index nudging 7,000. As the year 2000 unfolded, a combination of overvaluation, epitomised by the rapidly inflating ‘dotcom bubble’, and a global economic slowdown brought further investor jitters.

The bull market had marched the FTSE 100 up the hill; the ensuing three-year bear market marched it back down again to around 3,600 in the spring of 2003. The index would take another five years to climb back above 6,500, where it was delicately poised for the next big shock: the 2008 collapse of US investment bank Lehman Brothers and the cascade of failures prompting what became known simply as ‘the global financial crisis’. By March 2009, the index was down around 3,500 again.

Long term trend

It was a long haul back from there for the FTSE 100 but, after gyrations associated with various stages of the Brexit process, the start of 2020 saw it comfortably above 7,000. News of a new virus outbreak in an unfamiliar Chinese city seemed at first like a distant threat. As the outbreak turned into a pandemic, global markets faltered again and the FTSE 100 headed below 5,000 before recovering some of the loss. COVID-19 has brought a reset of the blue- chip barometer, the FTSE 100 index.

Despite a variety of market shocks and rebounds, the index still has a long term growth trend. It is important to remember that some market volatility is inevitable; markets will always move up and down. As an investor, putting any short-term market volatility into historical context is useful.

Financial advice and regular reviews are essential to help position your portfolio in line with your objectives and attitude to risk, and to develop a well-defined investment plan, tailored to your objectives and risk profile.

The ascent of the 1990s

Share-price recovery was slow, hampered by a short UK recession in 1991-92 caused in part by high interest rates and an over-valued pound associated with efforts to keep sterling within Europe’s exchange rate mechanism. After Chancellor Norman Lamont took sterling out of the ERM in September 1992, having spent billions and upped base rate to 15% trying to stay in, the index gained about 14% in six months.

As 1994 dawned, a decade on from its launch, the FTSE 100 stood at around 3,400; although then, as now, changes had been made to its constituent shares as companies’ respective market capitalisations waxed and waned. Concerns about the economy and tax plans dampened sentiment and the index fell below 3,000 during the first half of 1994 before starting a five-year ascent to break the 6,000 barrier in the summer of 1998. After a 500% rise in 14 years, what came next for the FTSE 100?

The value of investments can go down as well as up and you may not get back the full amount you invested.
T
he past is not a guide to future performance and past performance may not necessarily be repeated.

This material is intended to be for information purposes only and is not intended as an offer or solicitation for the purchase or sale of any financial instrument. It is not intended to provide and should not be relied on for accounting, legal or tax advice, or investment recommendations. Past performance is not a reliable indicator of future returns and all investments involve risks. Some information quoted was obtained from external sources we consider to be reliable.

Tees is a trading name of Tees Financial Limited which is authorised and regulated by the Financial Conduct Authority. Registered number 211314. Tees Financial Limited is registered in England and Wales. Registered number 4342506.